Tutorial: die erste Abbildung
Das Ziel dieses Tutorial ist es, folgendes Bild zu erzeugen:
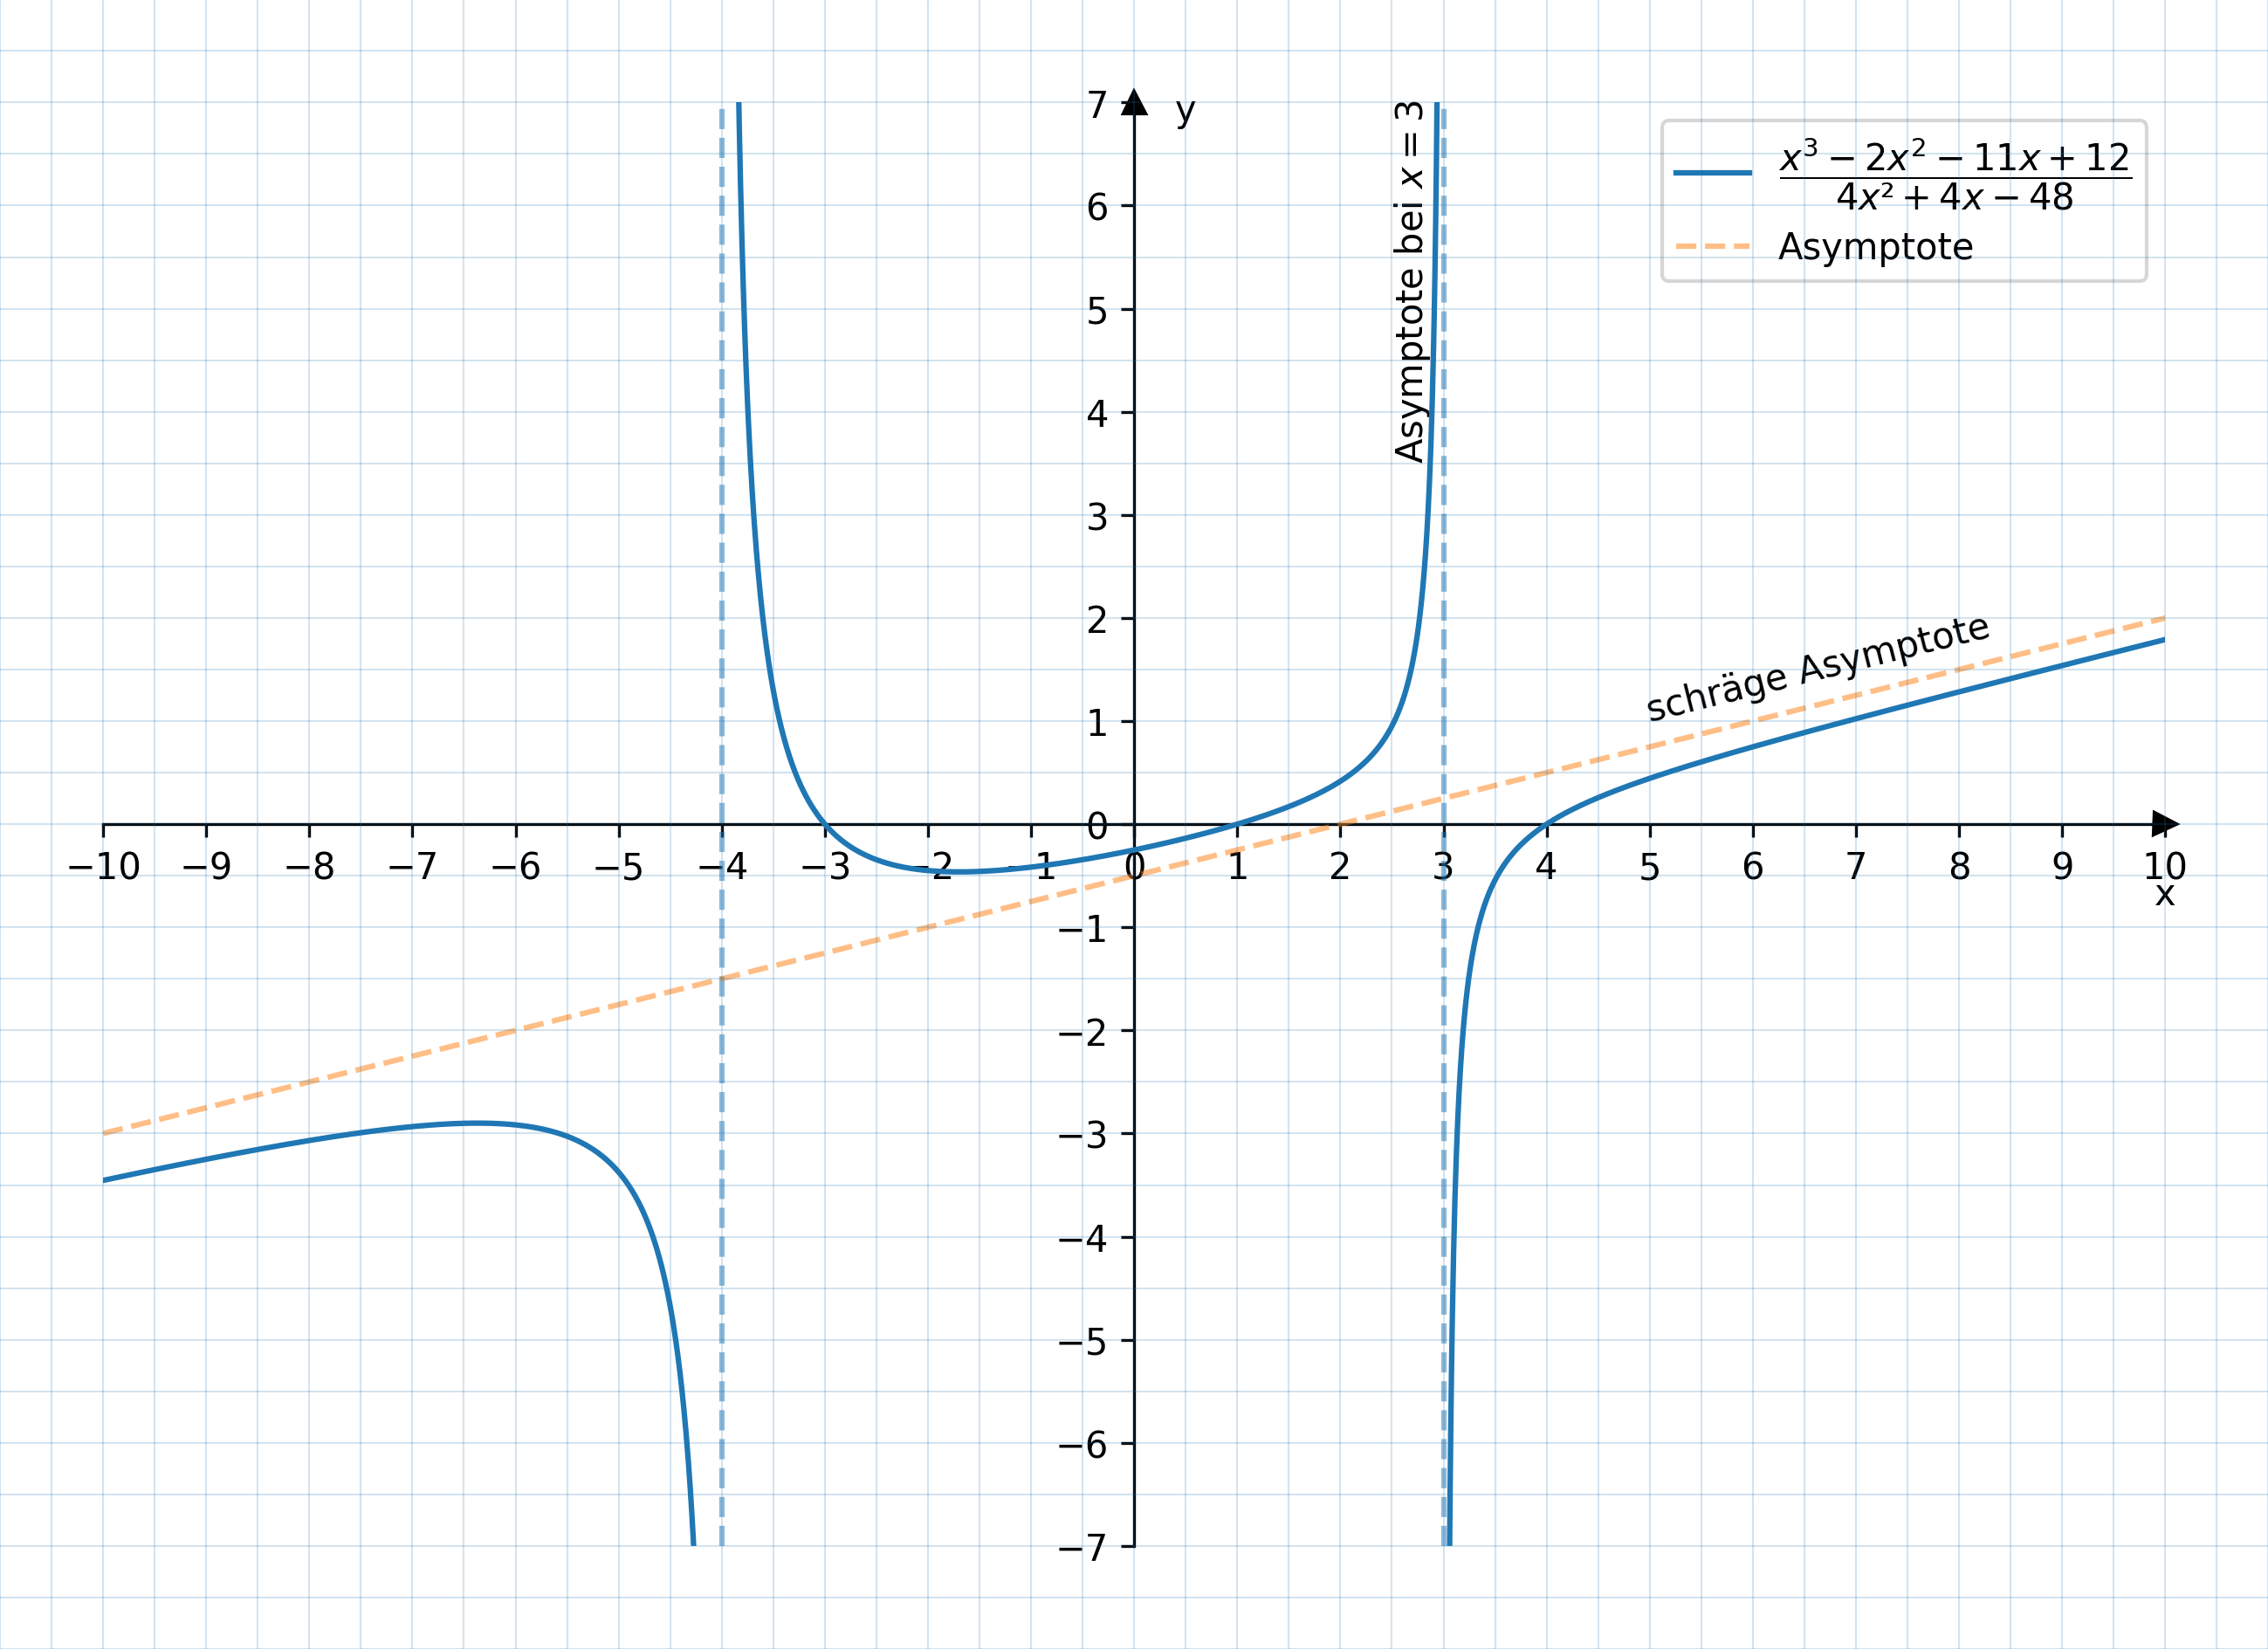
Dargestellt wird die Funktion
\[
f(x) \frac{x^3-2x^2-11x+12}{4x²+4x-48} = \frac{(x-4)(x-1)(x+3)}{4(x-3)(x+4)}
\]
mit sämtlichen Asymptoten, sowie eine Legende und erklärender Text.
Das Zeichenblatt
Wir erstellen ein Zeichenblatt, das 22 cm breit und 16 cm hoch ist. Ohne weitere Angaben besitzt das Zeichenblatt ein 5 mm - Karo.

figure:
  height: 16cm
  width: 22cm
axes_descriptors: []
Das Achsensystem
Jetzt kommt das Koordinatensystem; es soll 20 cm breit sein und 14 cm hoch (Zeile 6-7). Der Abstand zum unteren und zum linken Rand soll jeweils 1 cm betragen (Zeile 10-11).
Der kleinste angezeigte x-Wert ist x=-10, und der kleinste angezeigte y-Wert ist y=-7 (Zeile 8-9). Die angaben sind in Längeneinheiten, die standardmäßig 1 cm lang sind.
| figure:
height: 16cm
width: 22cm
axes_descriptors:
- axes:
height: 14cm
width: 20cm
x_min: -10
y_min: -7
bottom: 1cm
left: 1cm
|
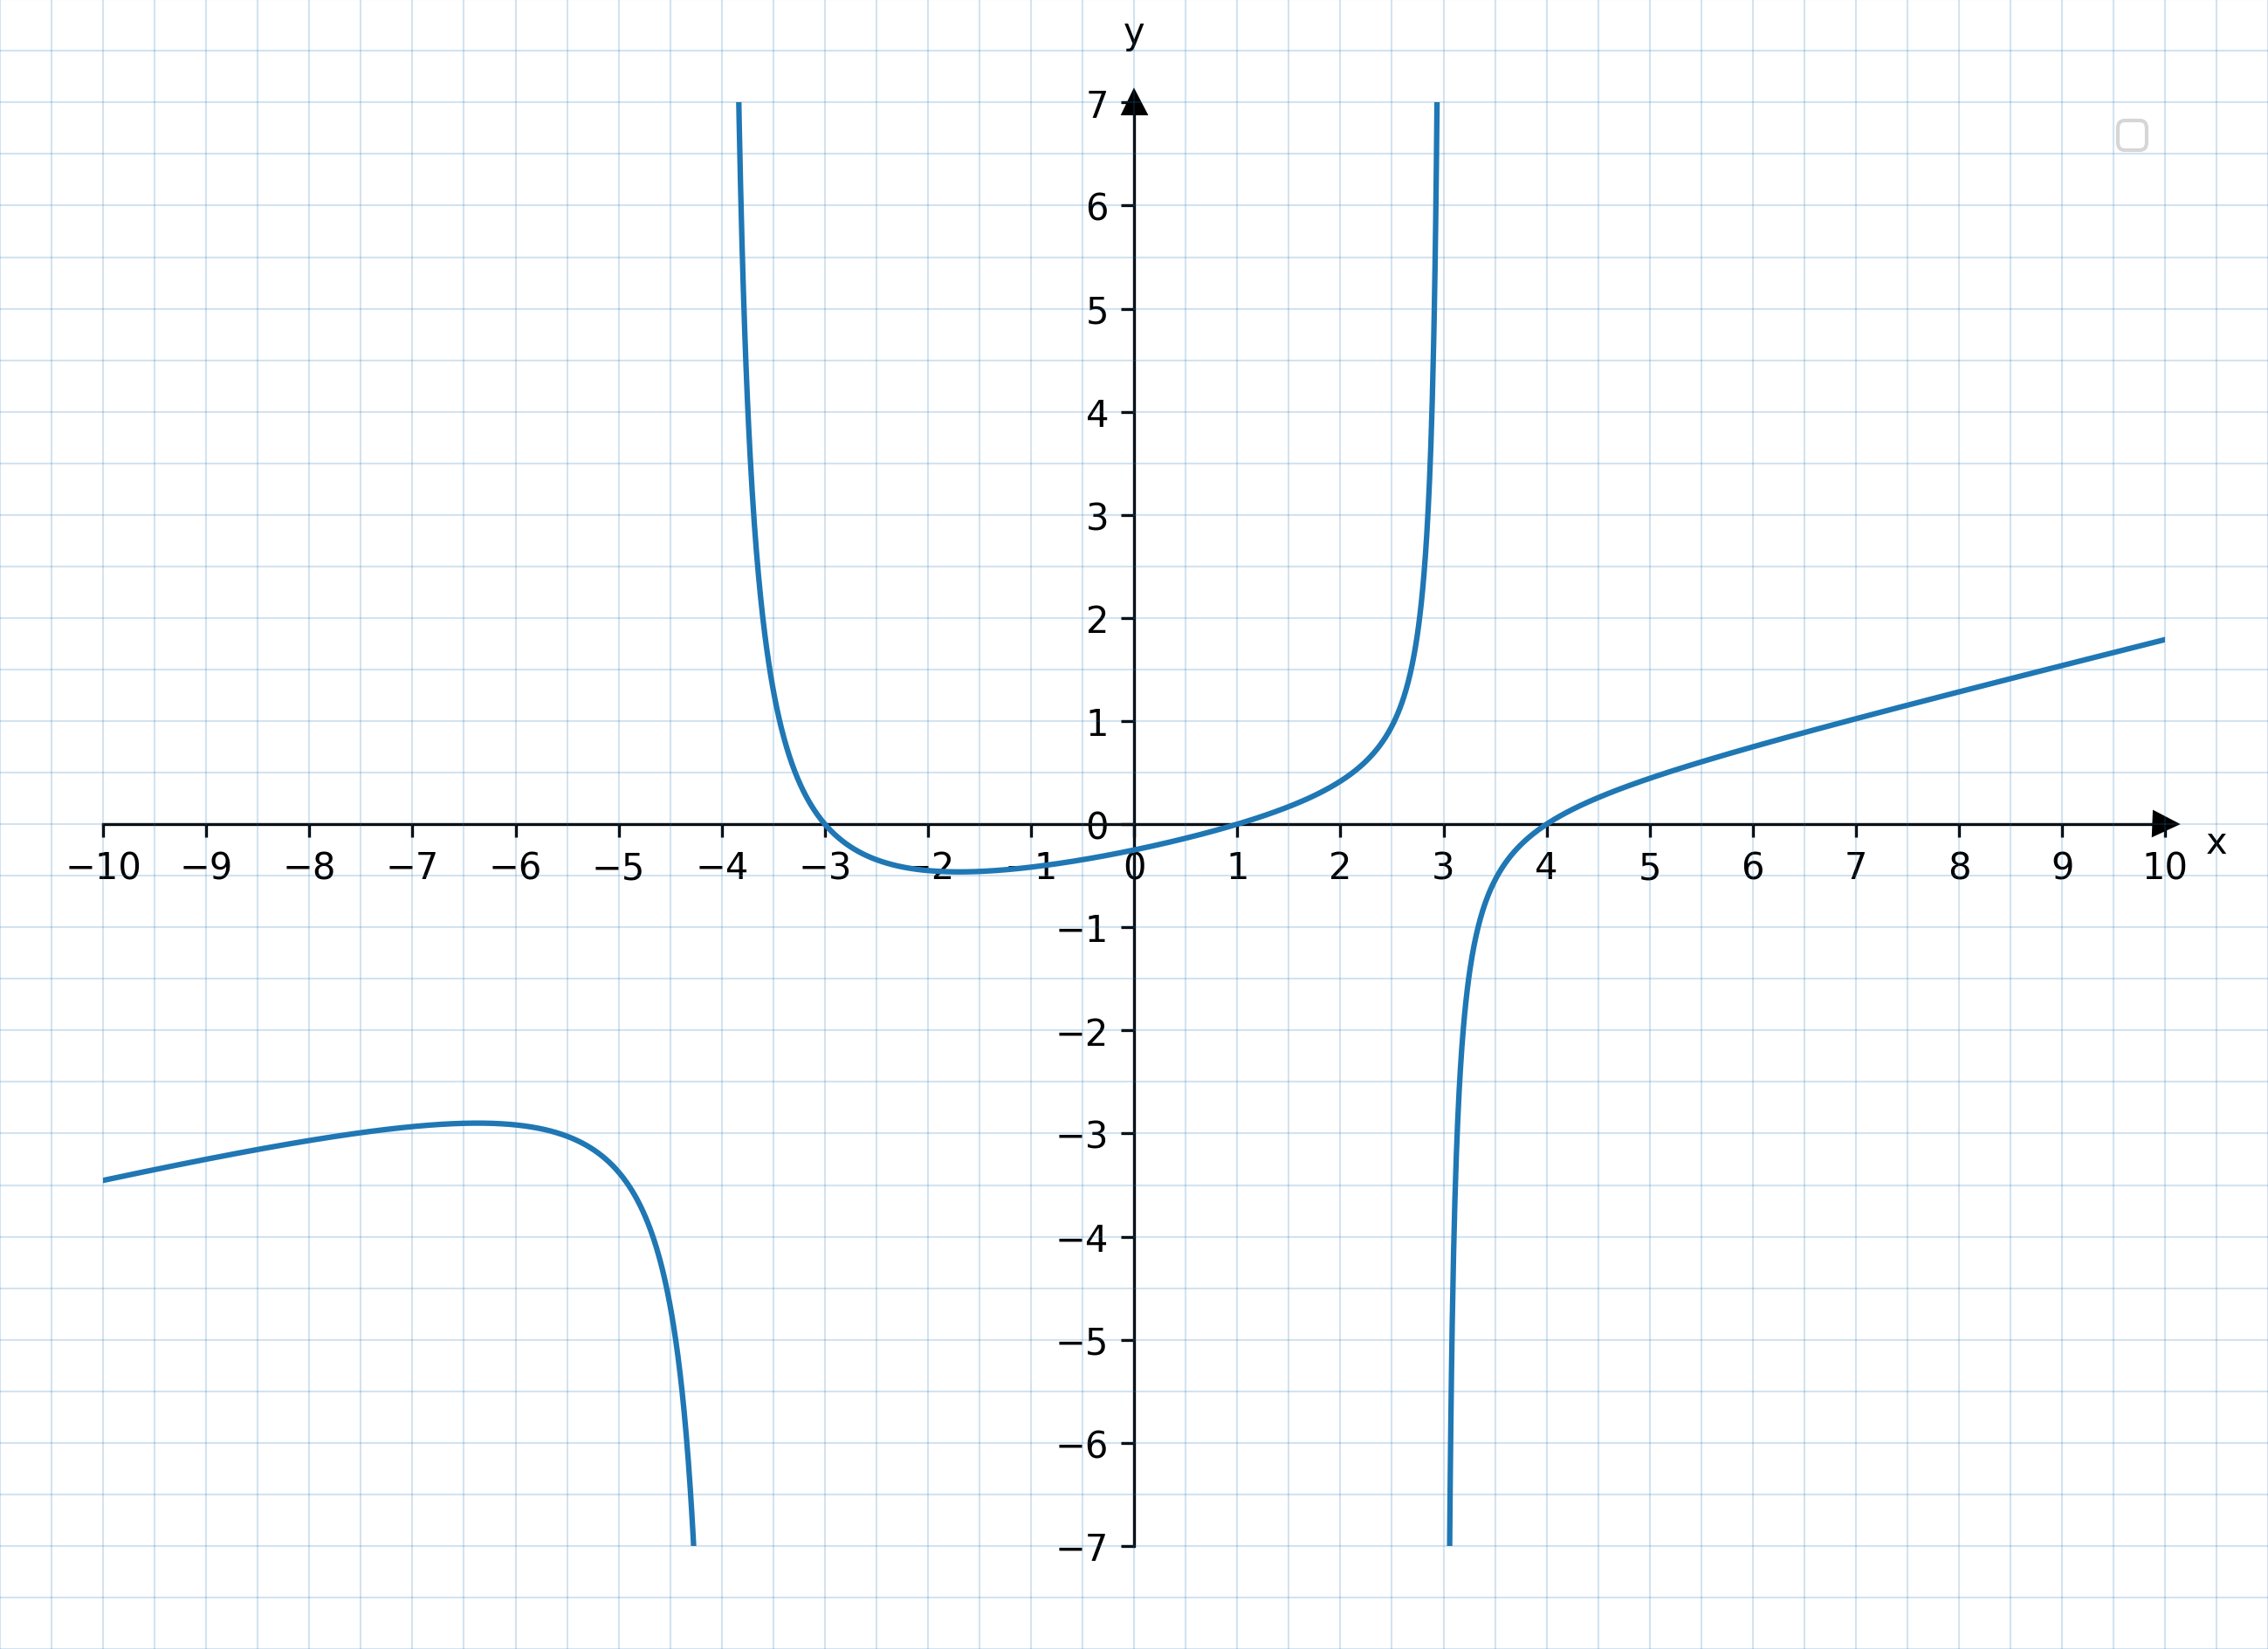
Die erste Funktion
Alle weiteren sichtbaren Elemente in einem Achsensystem werden im Abschnitt items eingefügt (Zeile 12). Jeder Eintrage beginnt mit einem Spiegelstrich, und der Angabe des Typs des Elements, das eingefügt werden soll. Der Typ Graph steht für einen Funktionsgraph.
Die Funktion wird in Zeile 14 angegeben.
| figure:
height: 16cm
width: 22cm
axes_descriptors:
- axes:
height: 14cm
width: 20cm
x_min: -10
y_min: -7
bottom: 1cm
left: 1cm
items:
- type: Graph
function: (x-4)*(x-1)*(x+3) / (4*(x-3)*(x+4))
|
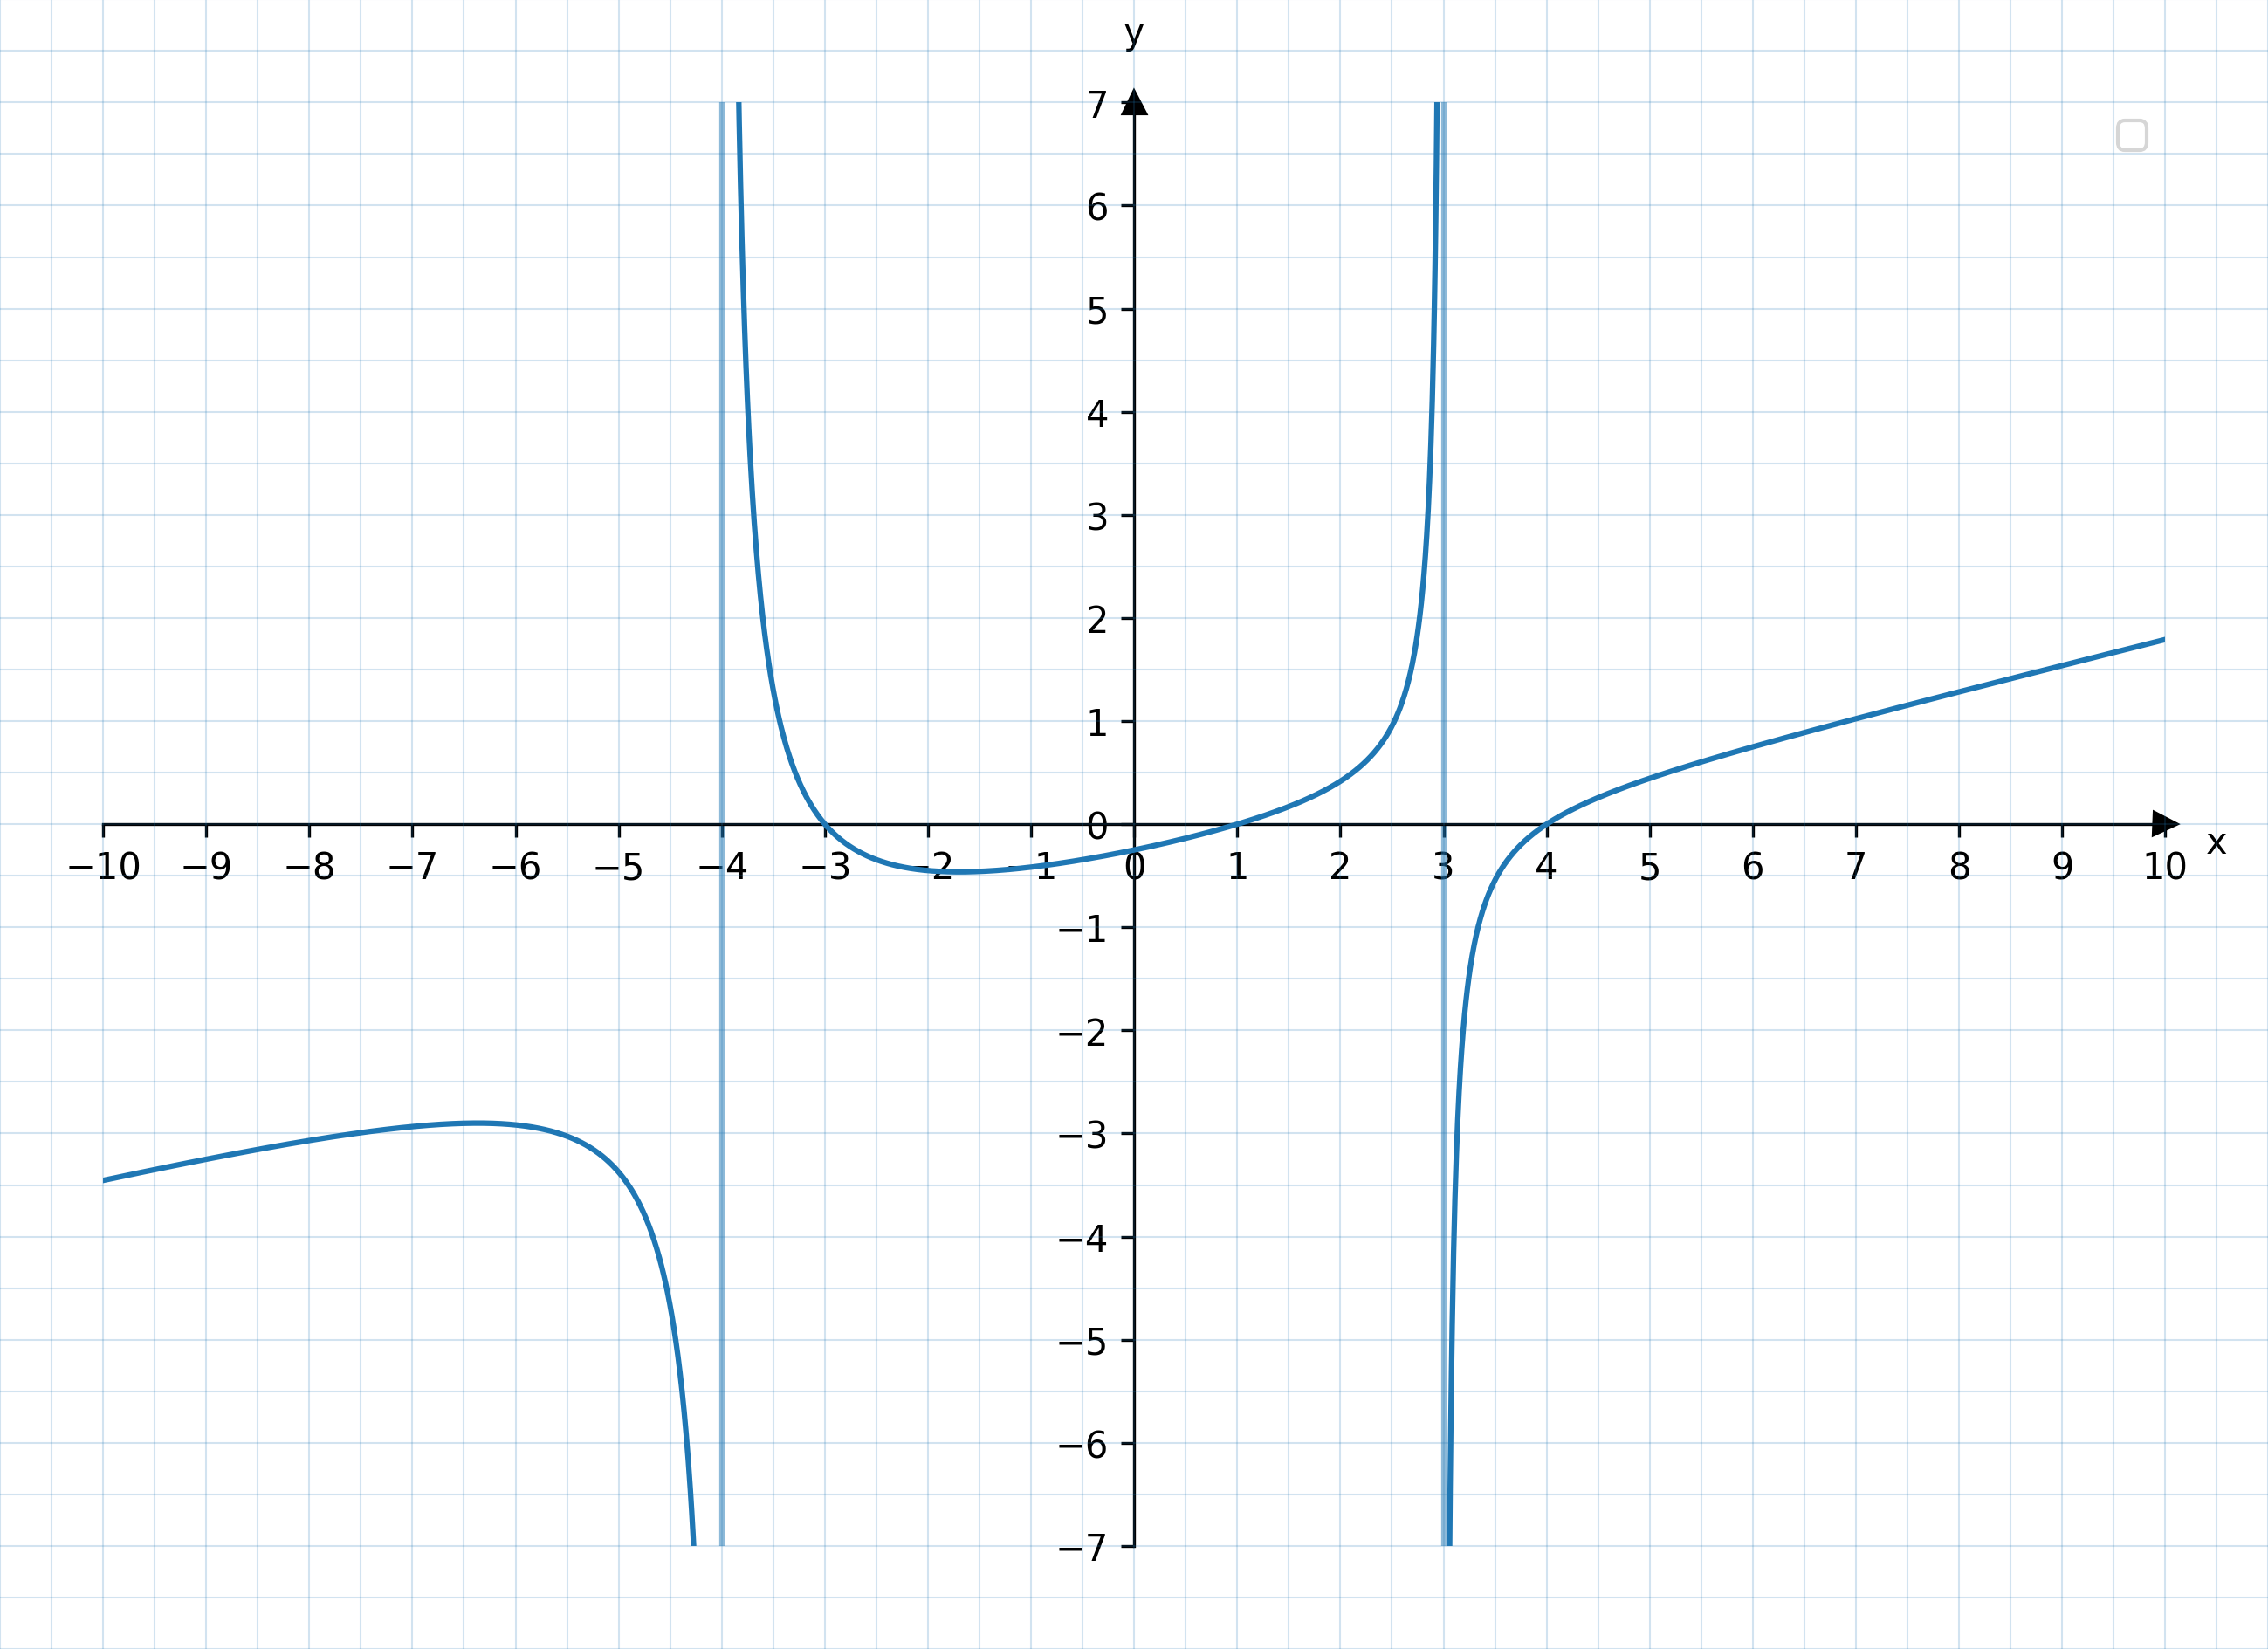
Senkrechte Asymptoten
Die senkrechten Asymptoten sind vertikale Geraden. Diese können mit dem Typ VLine unter items unter Angabe des x-Werts eingefügt werden (Z. 15-18.)
| figure:
height: 16cm
width: 22cm
axes_descriptors:
- axes:
height: 14cm
width: 20cm
x_min: -10
y_min: -7
bottom: 1cm
left: 1cm
items:
- type: Graph
function: (x-4)*(x-1)*(x+3) / (4*(x-3)*(x+4))
- type: VLine
x: 3
- type: VLine
x: -4
|
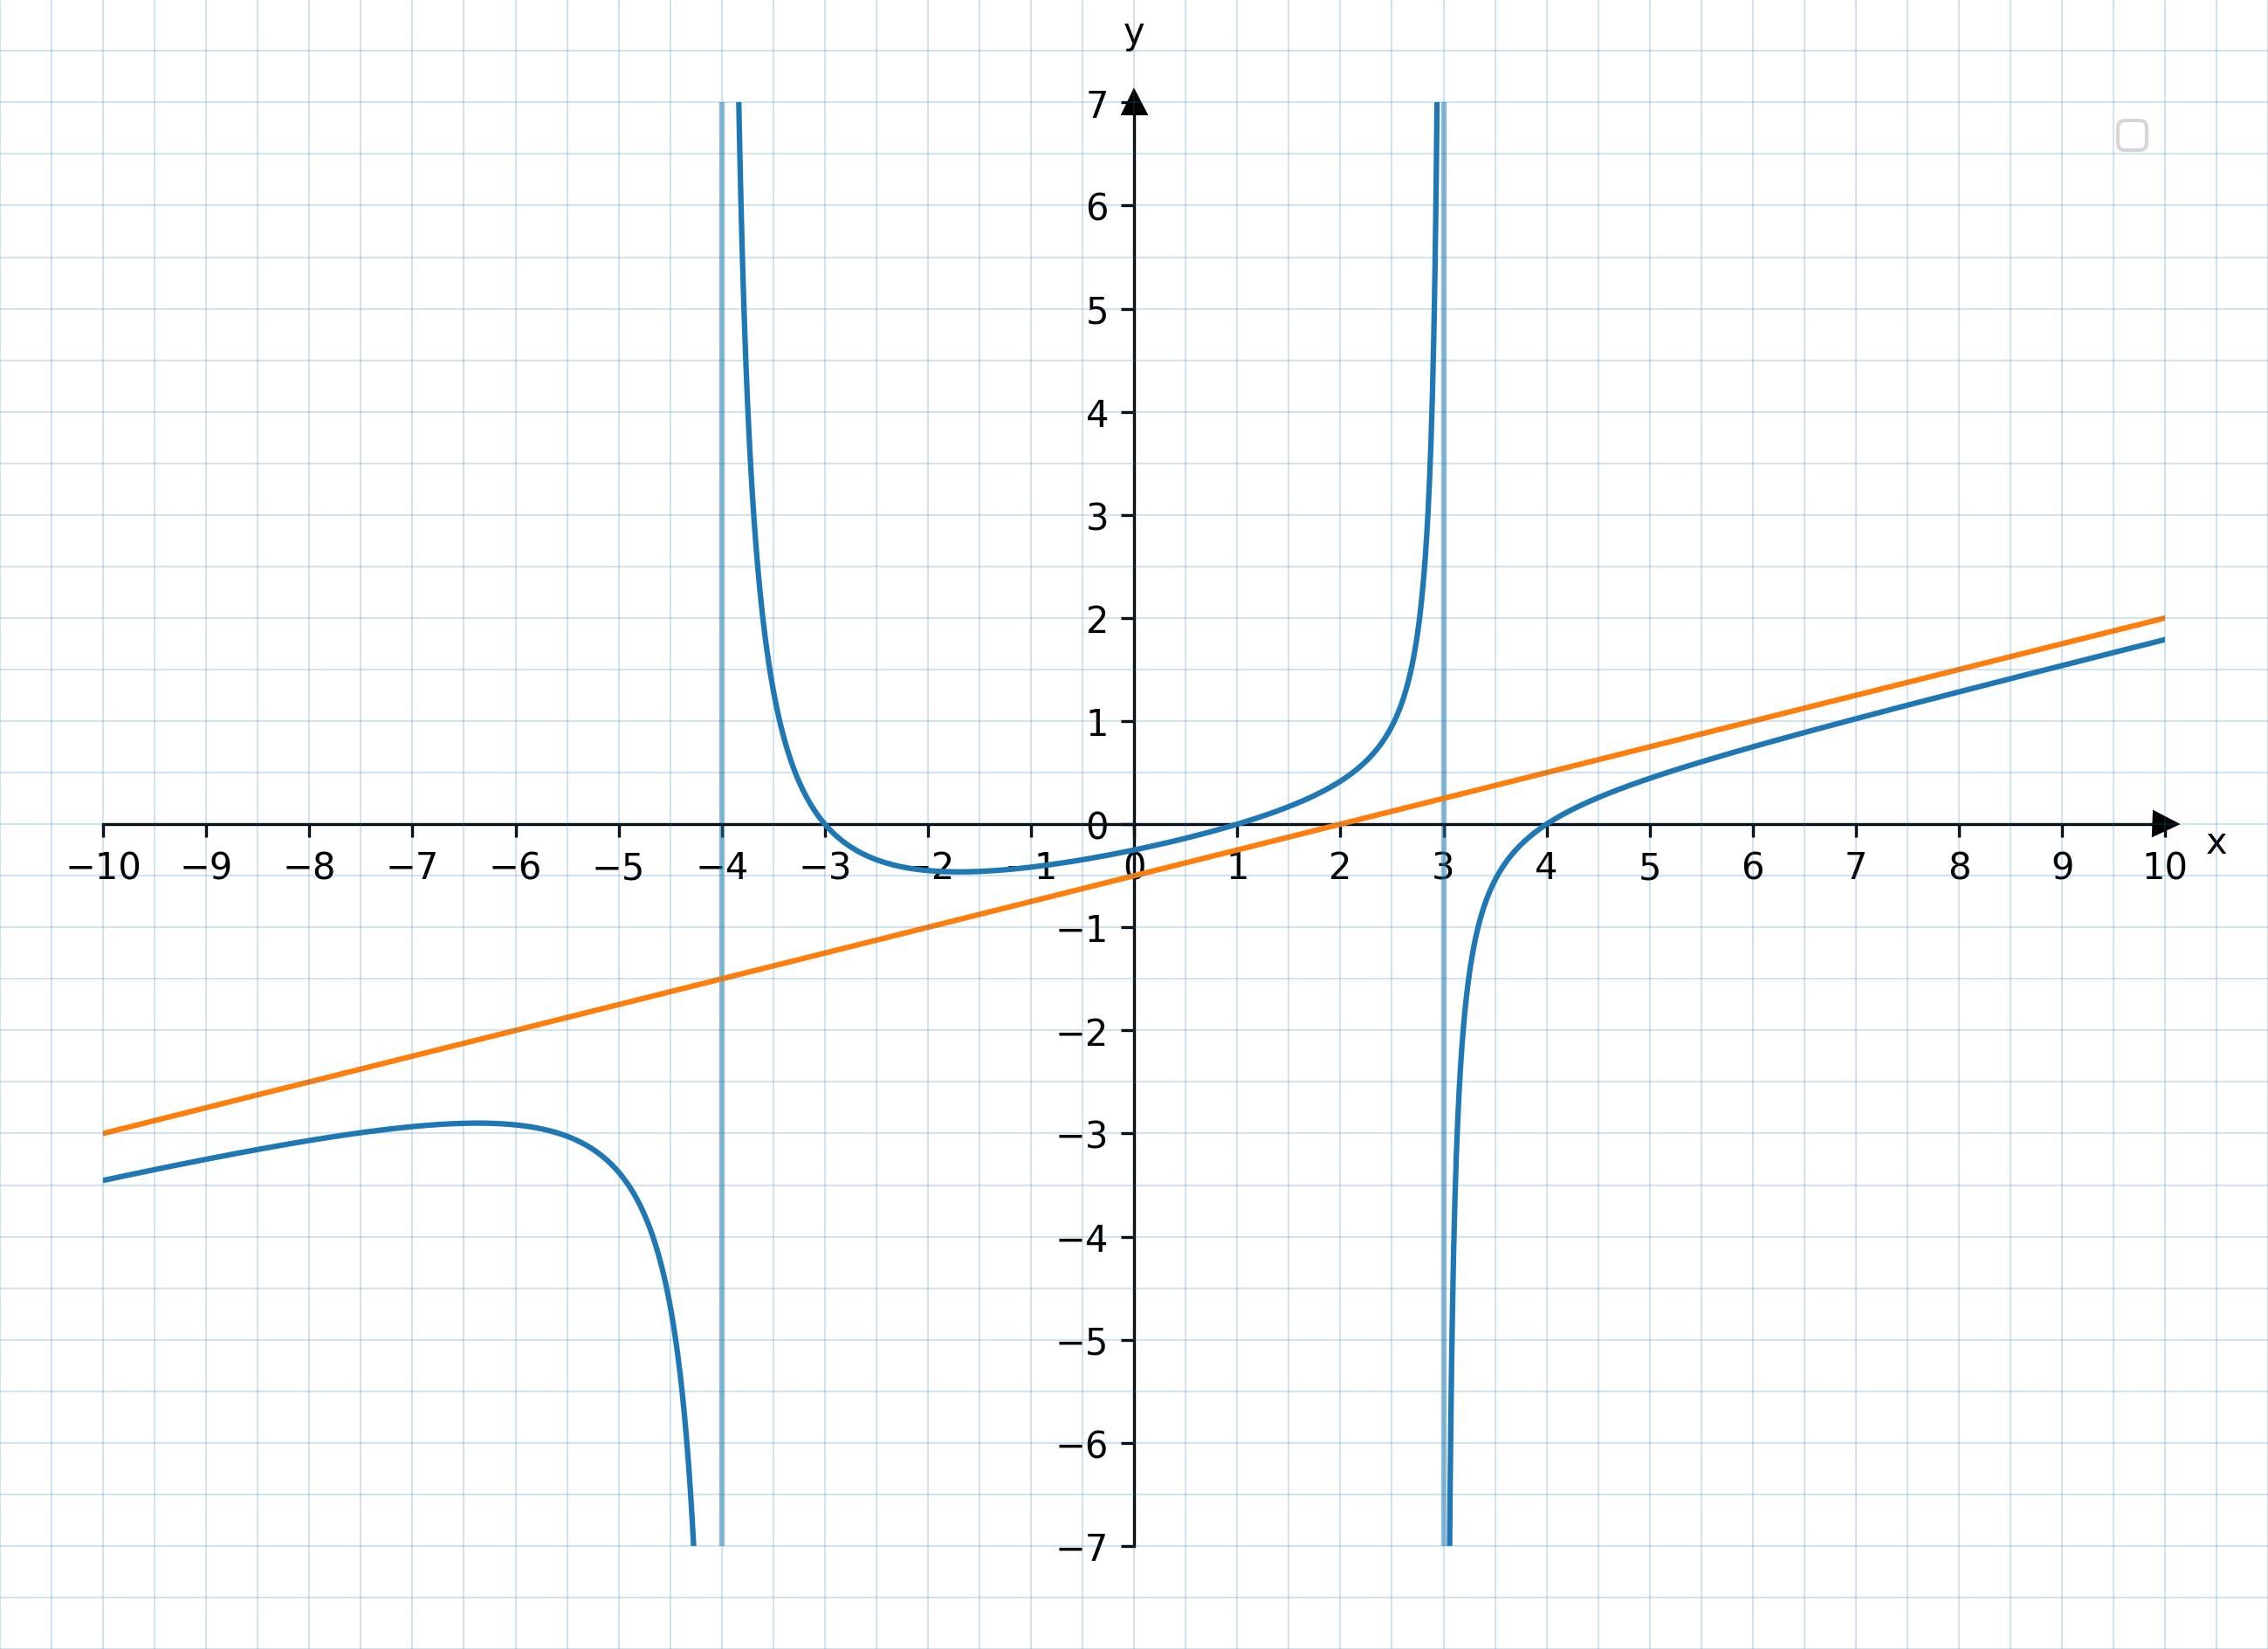
Die schräge Asymptote
Die schräge Asymptote hat die Funktionsgleichung \(g(x) = \frac{1}{4}x- \frac{1}{2}\). Wir fügen ein sie unter items ein, indem wir wieder den Typ Graph wählen, und den Funktionsterm angeben.
| figure:
height: 16cm
width: 22cm
axes_descriptors:
- axes:
height: 14cm
width: 20cm
x_min: -10
y_min: -7
bottom: 1cm
left: 1cm
items:
- type: Graph
function: (x-4)*(x-1)*(x+3) / (4*(x-3)*(x+4))
- type: Graph
function: 1/4*x -0.5
- type: VLine
x: 3
- type: VLine
x: -4
|
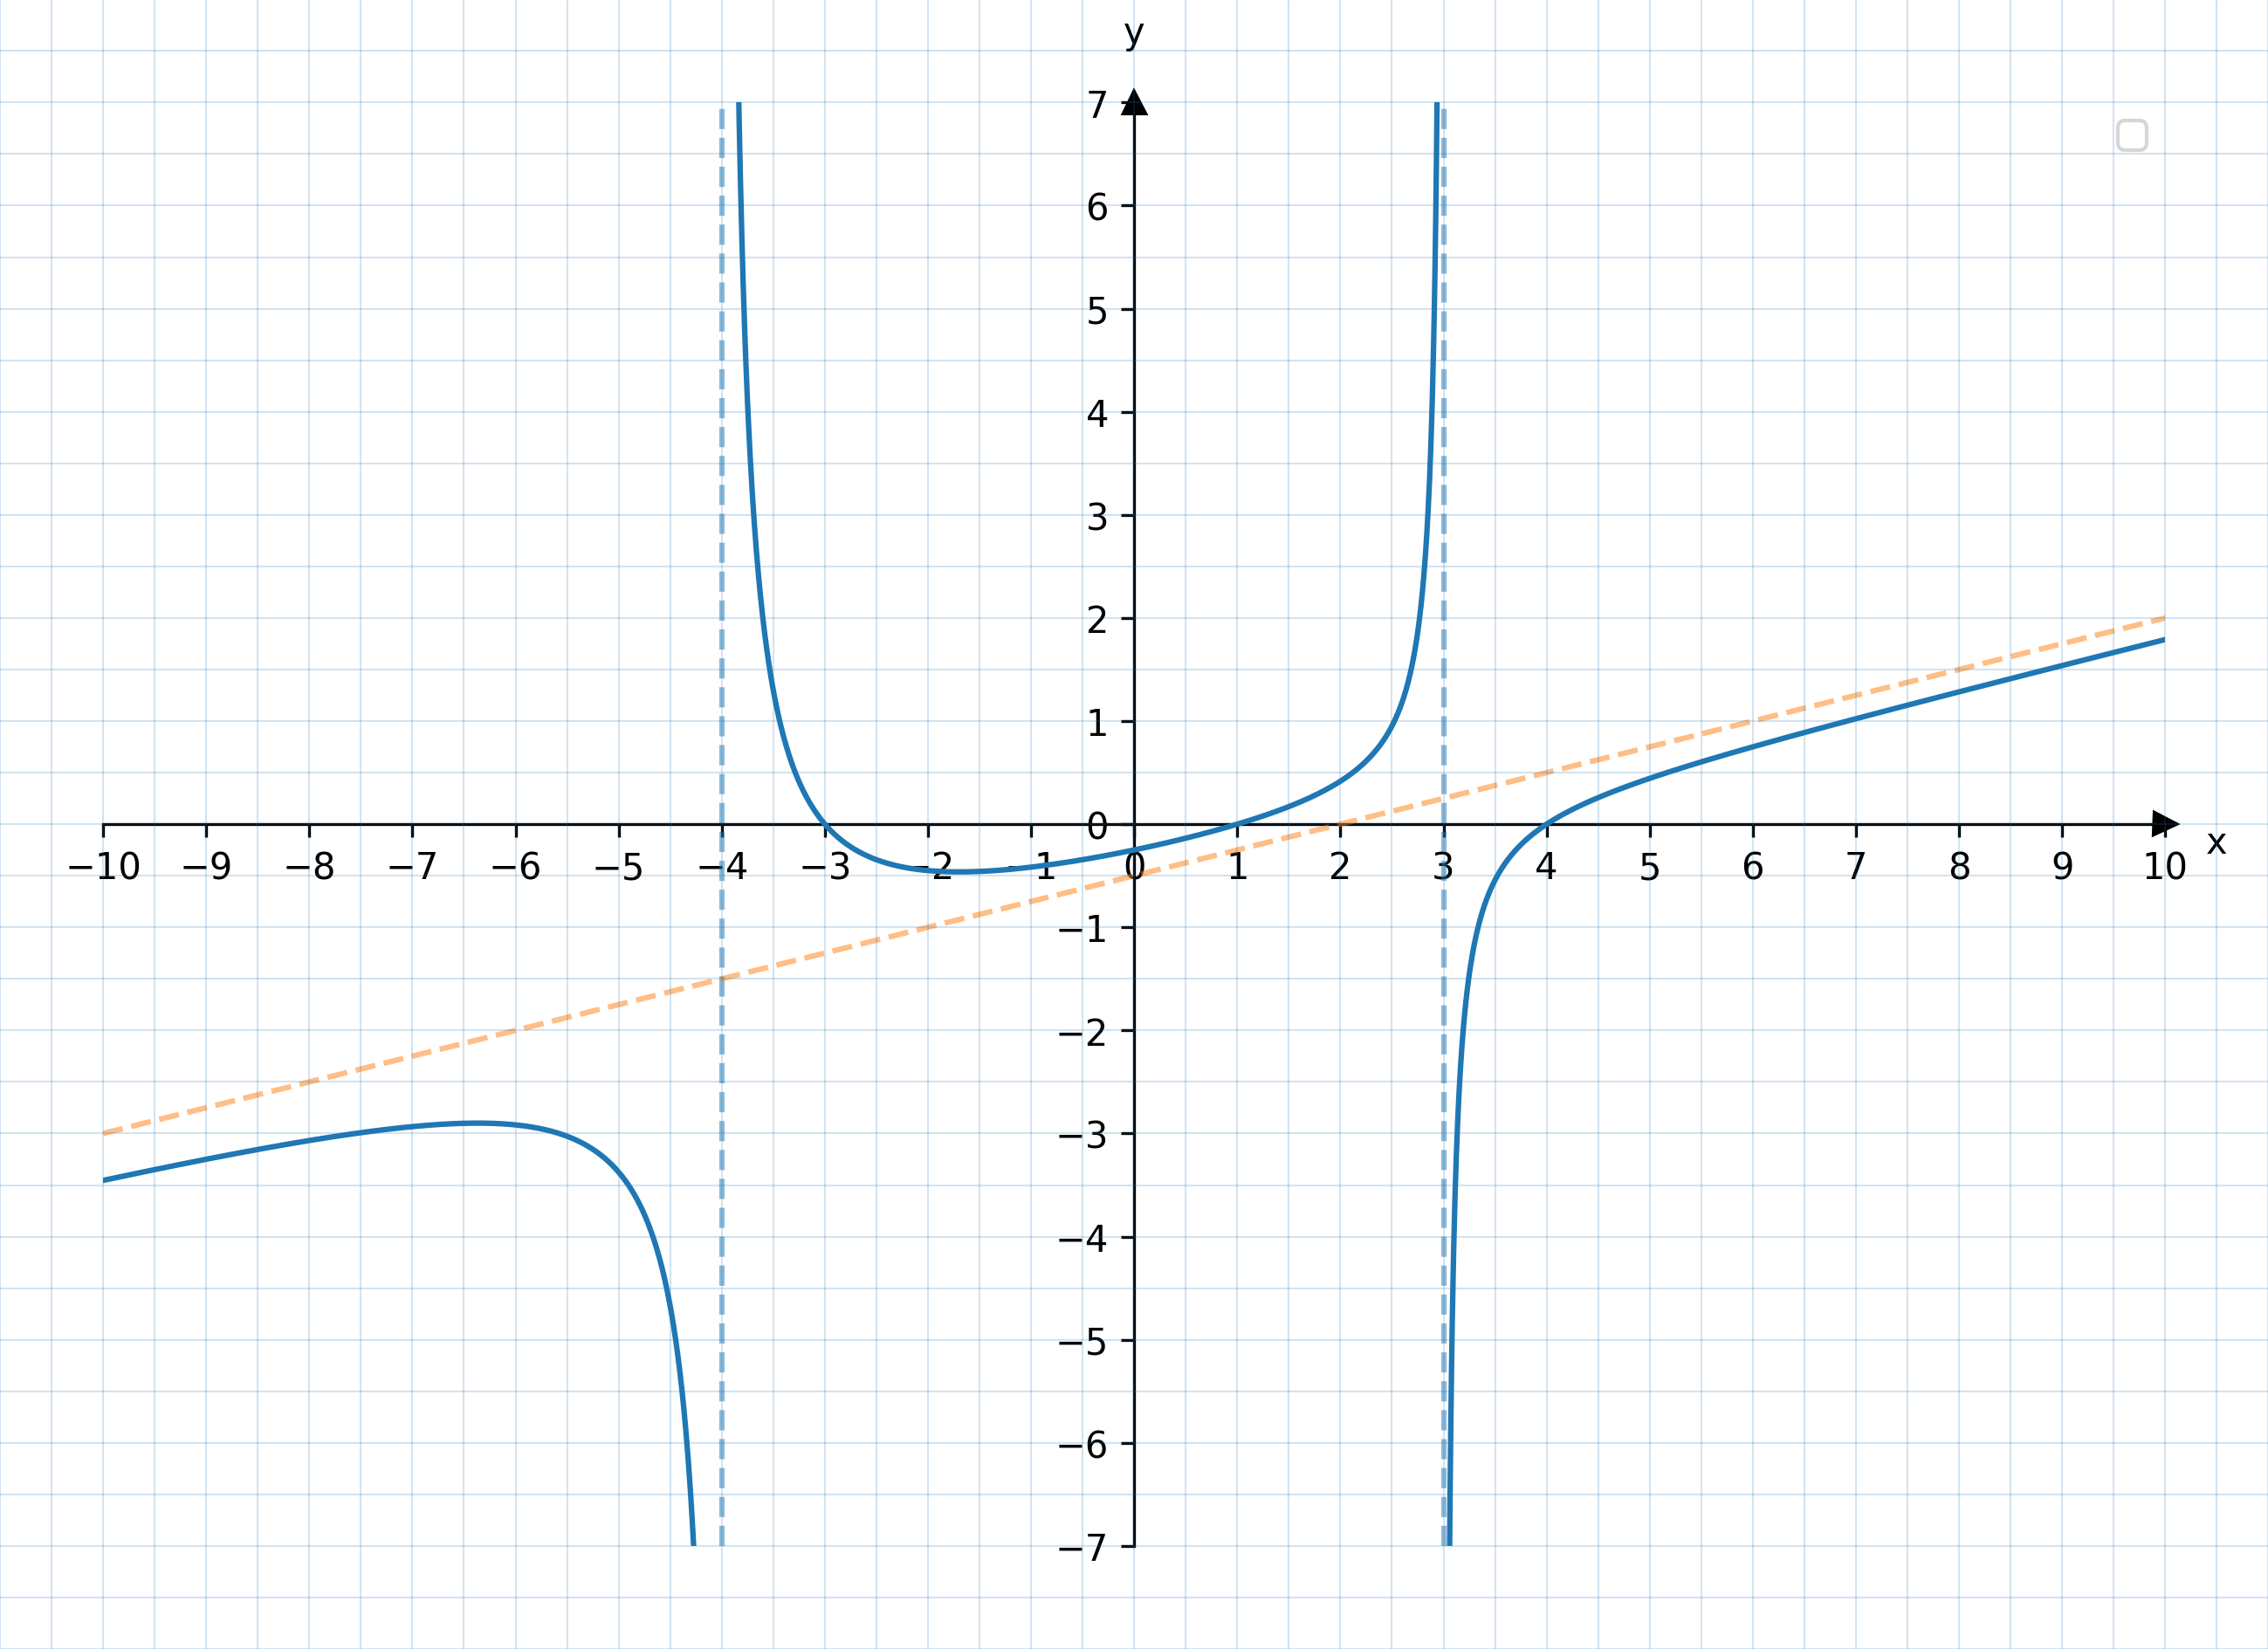
Eigenschaften der Linien
Asymptoten sollen gestrichelt gezeichnet werden. Das kann man bei den Typen Graph und VLine im Abschnitt plot_args angeben. ls ist eine Abkürzung für linestyle, und die Angabe von -- erzeugt eine gestrichelte Linie. Der bei alpha angegebene Wert von 0.5 verringert die Deckkraft der Farben auf 50%.
| figure:
height: 16cm
width: 22cm
axes_descriptors:
- axes:
height: 14cm
width: 20cm
x_min: -10
y_min: -7
bottom: 1cm
left: 1cm
items:
- type: Graph
function: (x-4)*(x-1)*(x+3) / (4*(x-3)*(x+4))
- type: Graph
function: 1/4*x -0.5
plot_args:
ls: --
alpha: 0.5
- type: VLine
x: 3
plot_args:
ls: --
alpha: 0.5
- type: VLine
x: -4
plot_args:
ls: --
alpha: 0.5
|
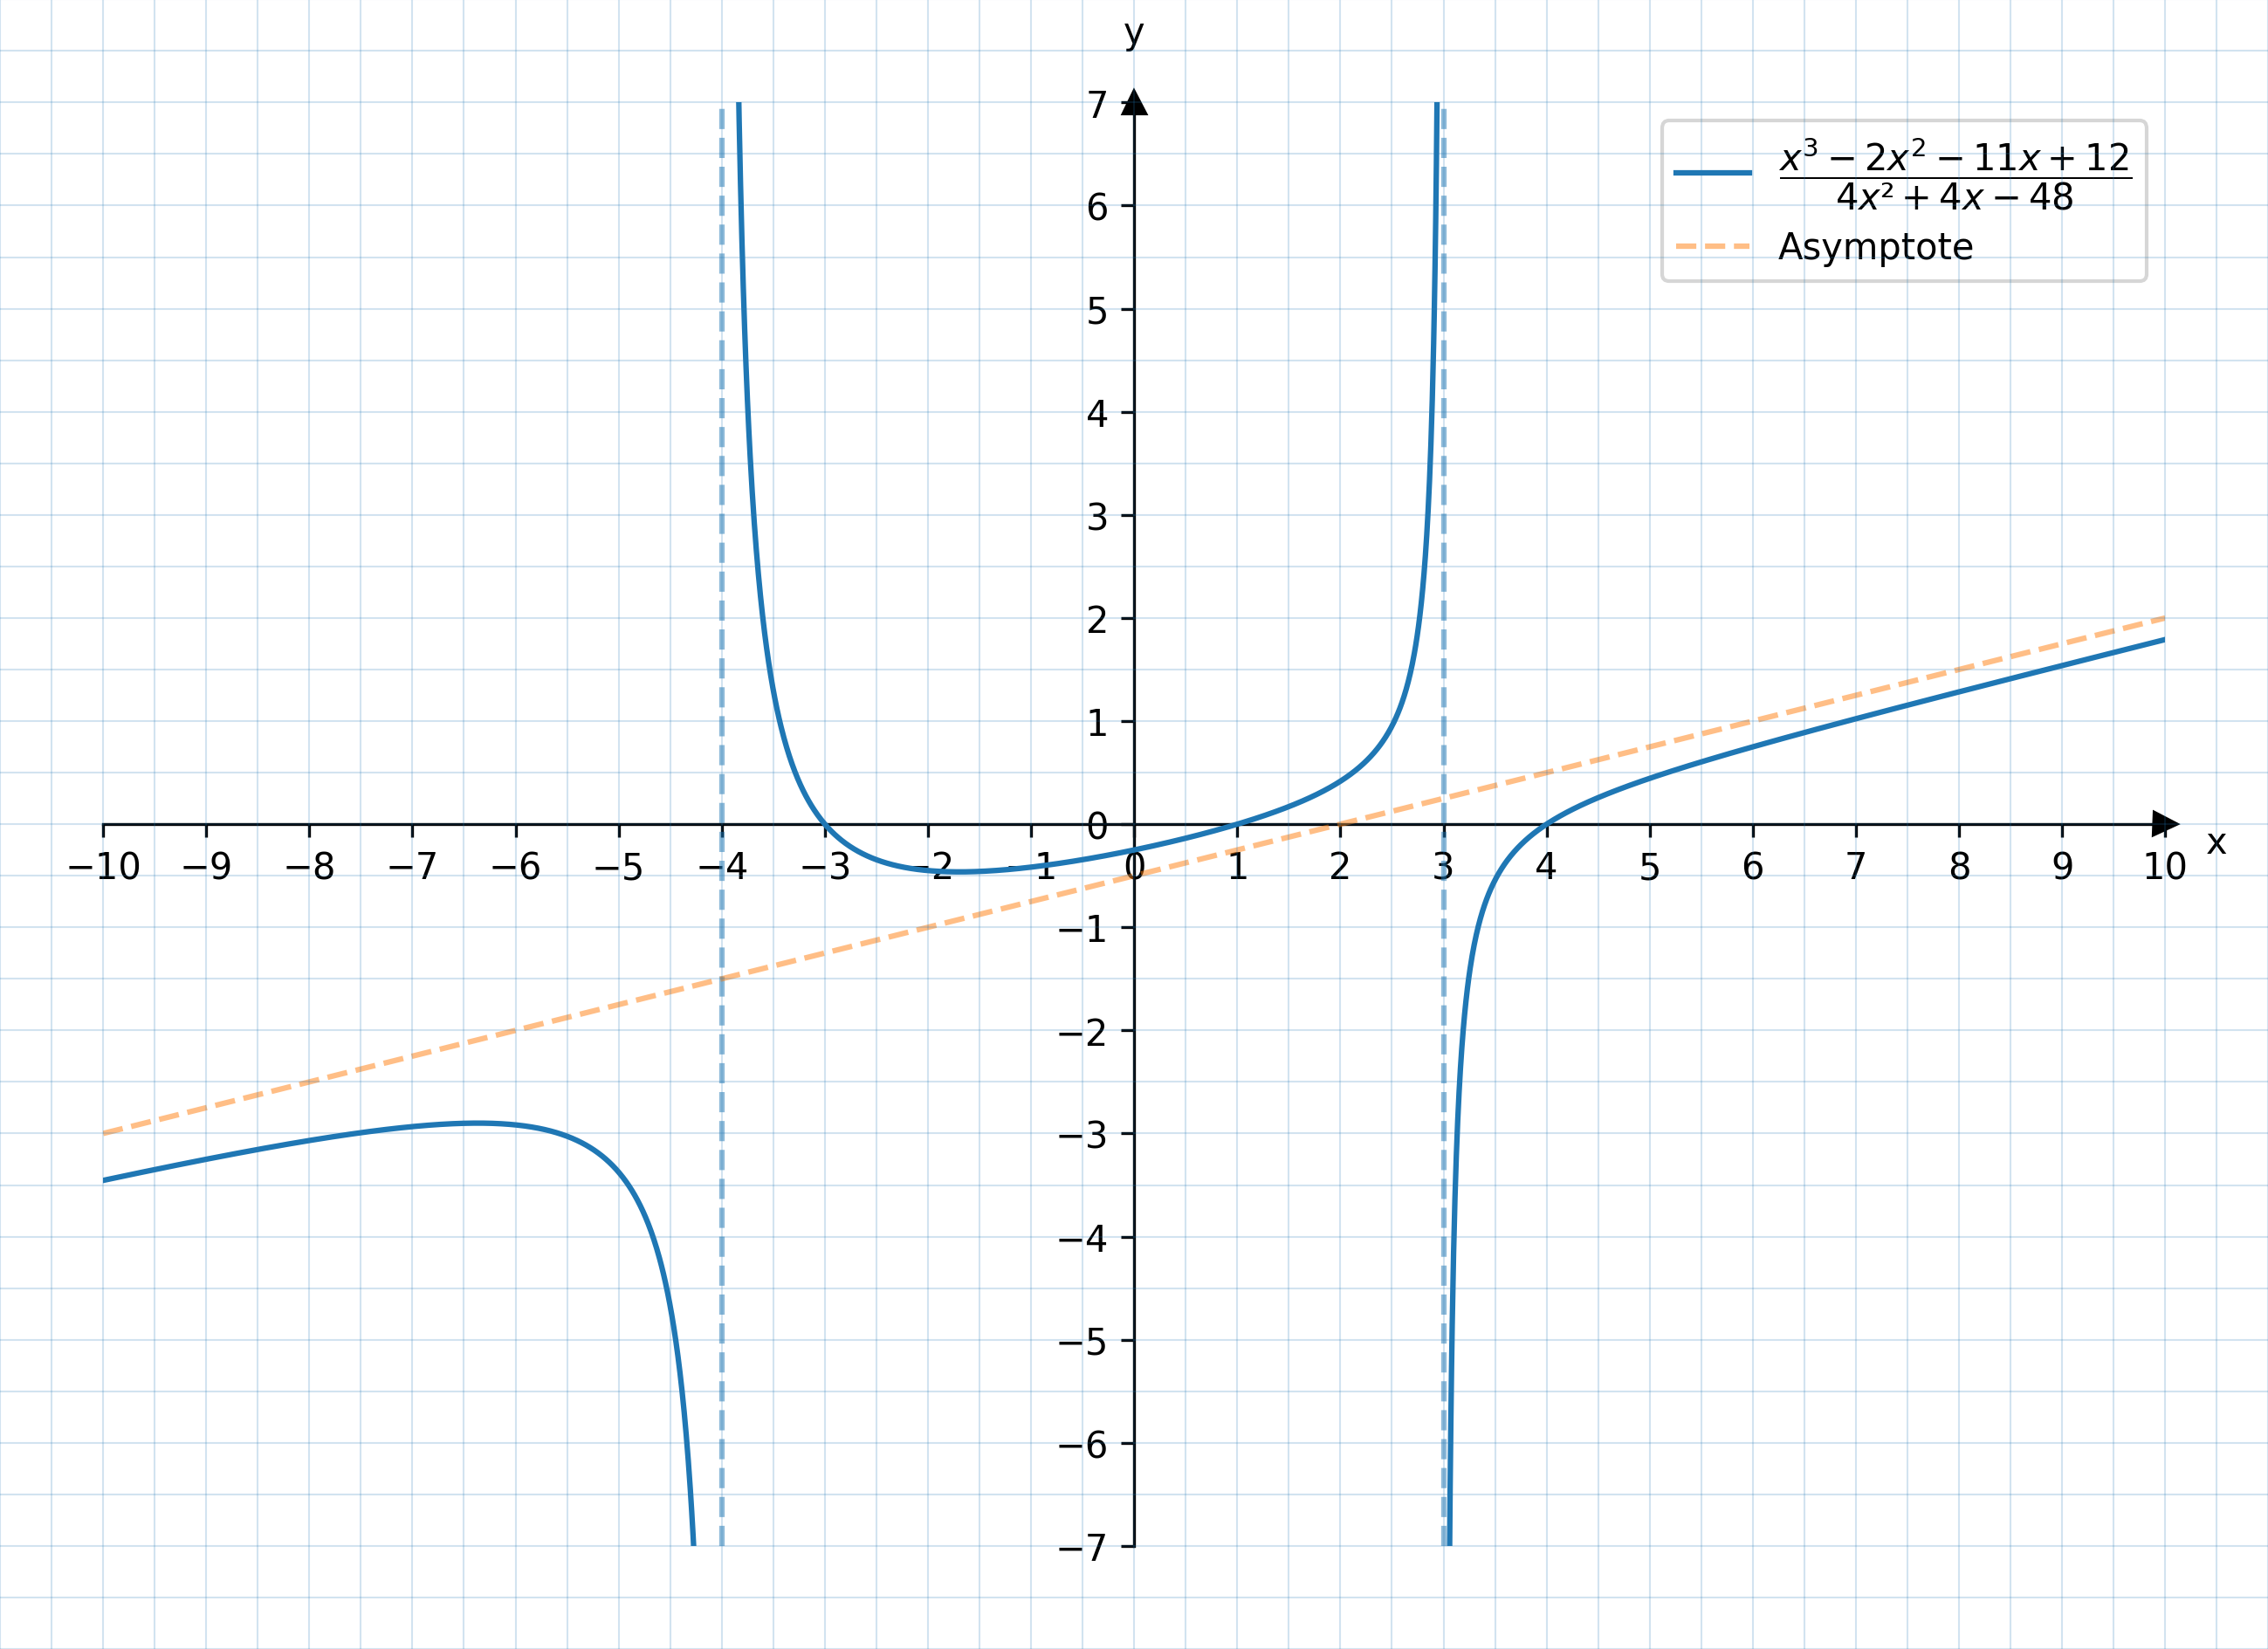
Legende
Standardmäßig wird eine Legende angezeigt; in den bisherigen Abbildungen war sie zwar sichtbar, aber leer. Wir können sie füllen, indem wir bei den Funktionen ein label angeben (Zeile 15 und 18).
Die Legende kann entweder ein beliebiger Text sein (Zeile 18), oder aber in LaTeX formatiert sein, wenn er zwischen $ Zeichen eingeschlossen ist (Zeile 15).
| figure:
height: 16cm
width: 22cm
axes_descriptors:
- axes:
height: 14cm
width: 20cm
x_min: -10
y_min: -7
bottom: 1cm
left: 1cm
items:
- type: Graph
function: (x-4)*(x-1)*(x+3) / (4*(x-3)*(x+4))
label: $\dfrac{x^3-2x^2-11x+12}{4x²+4x-48}$
- type: Graph
function: 1/4*x -0.5
label: Asymptote
plot_args:
ls: --
alpha: 0.5
- type: VLine
x: 3
plot_args:
ls: --
alpha: 0.5
- type: VLine
x: -4
plot_args:
ls: --
alpha: 0.5
|
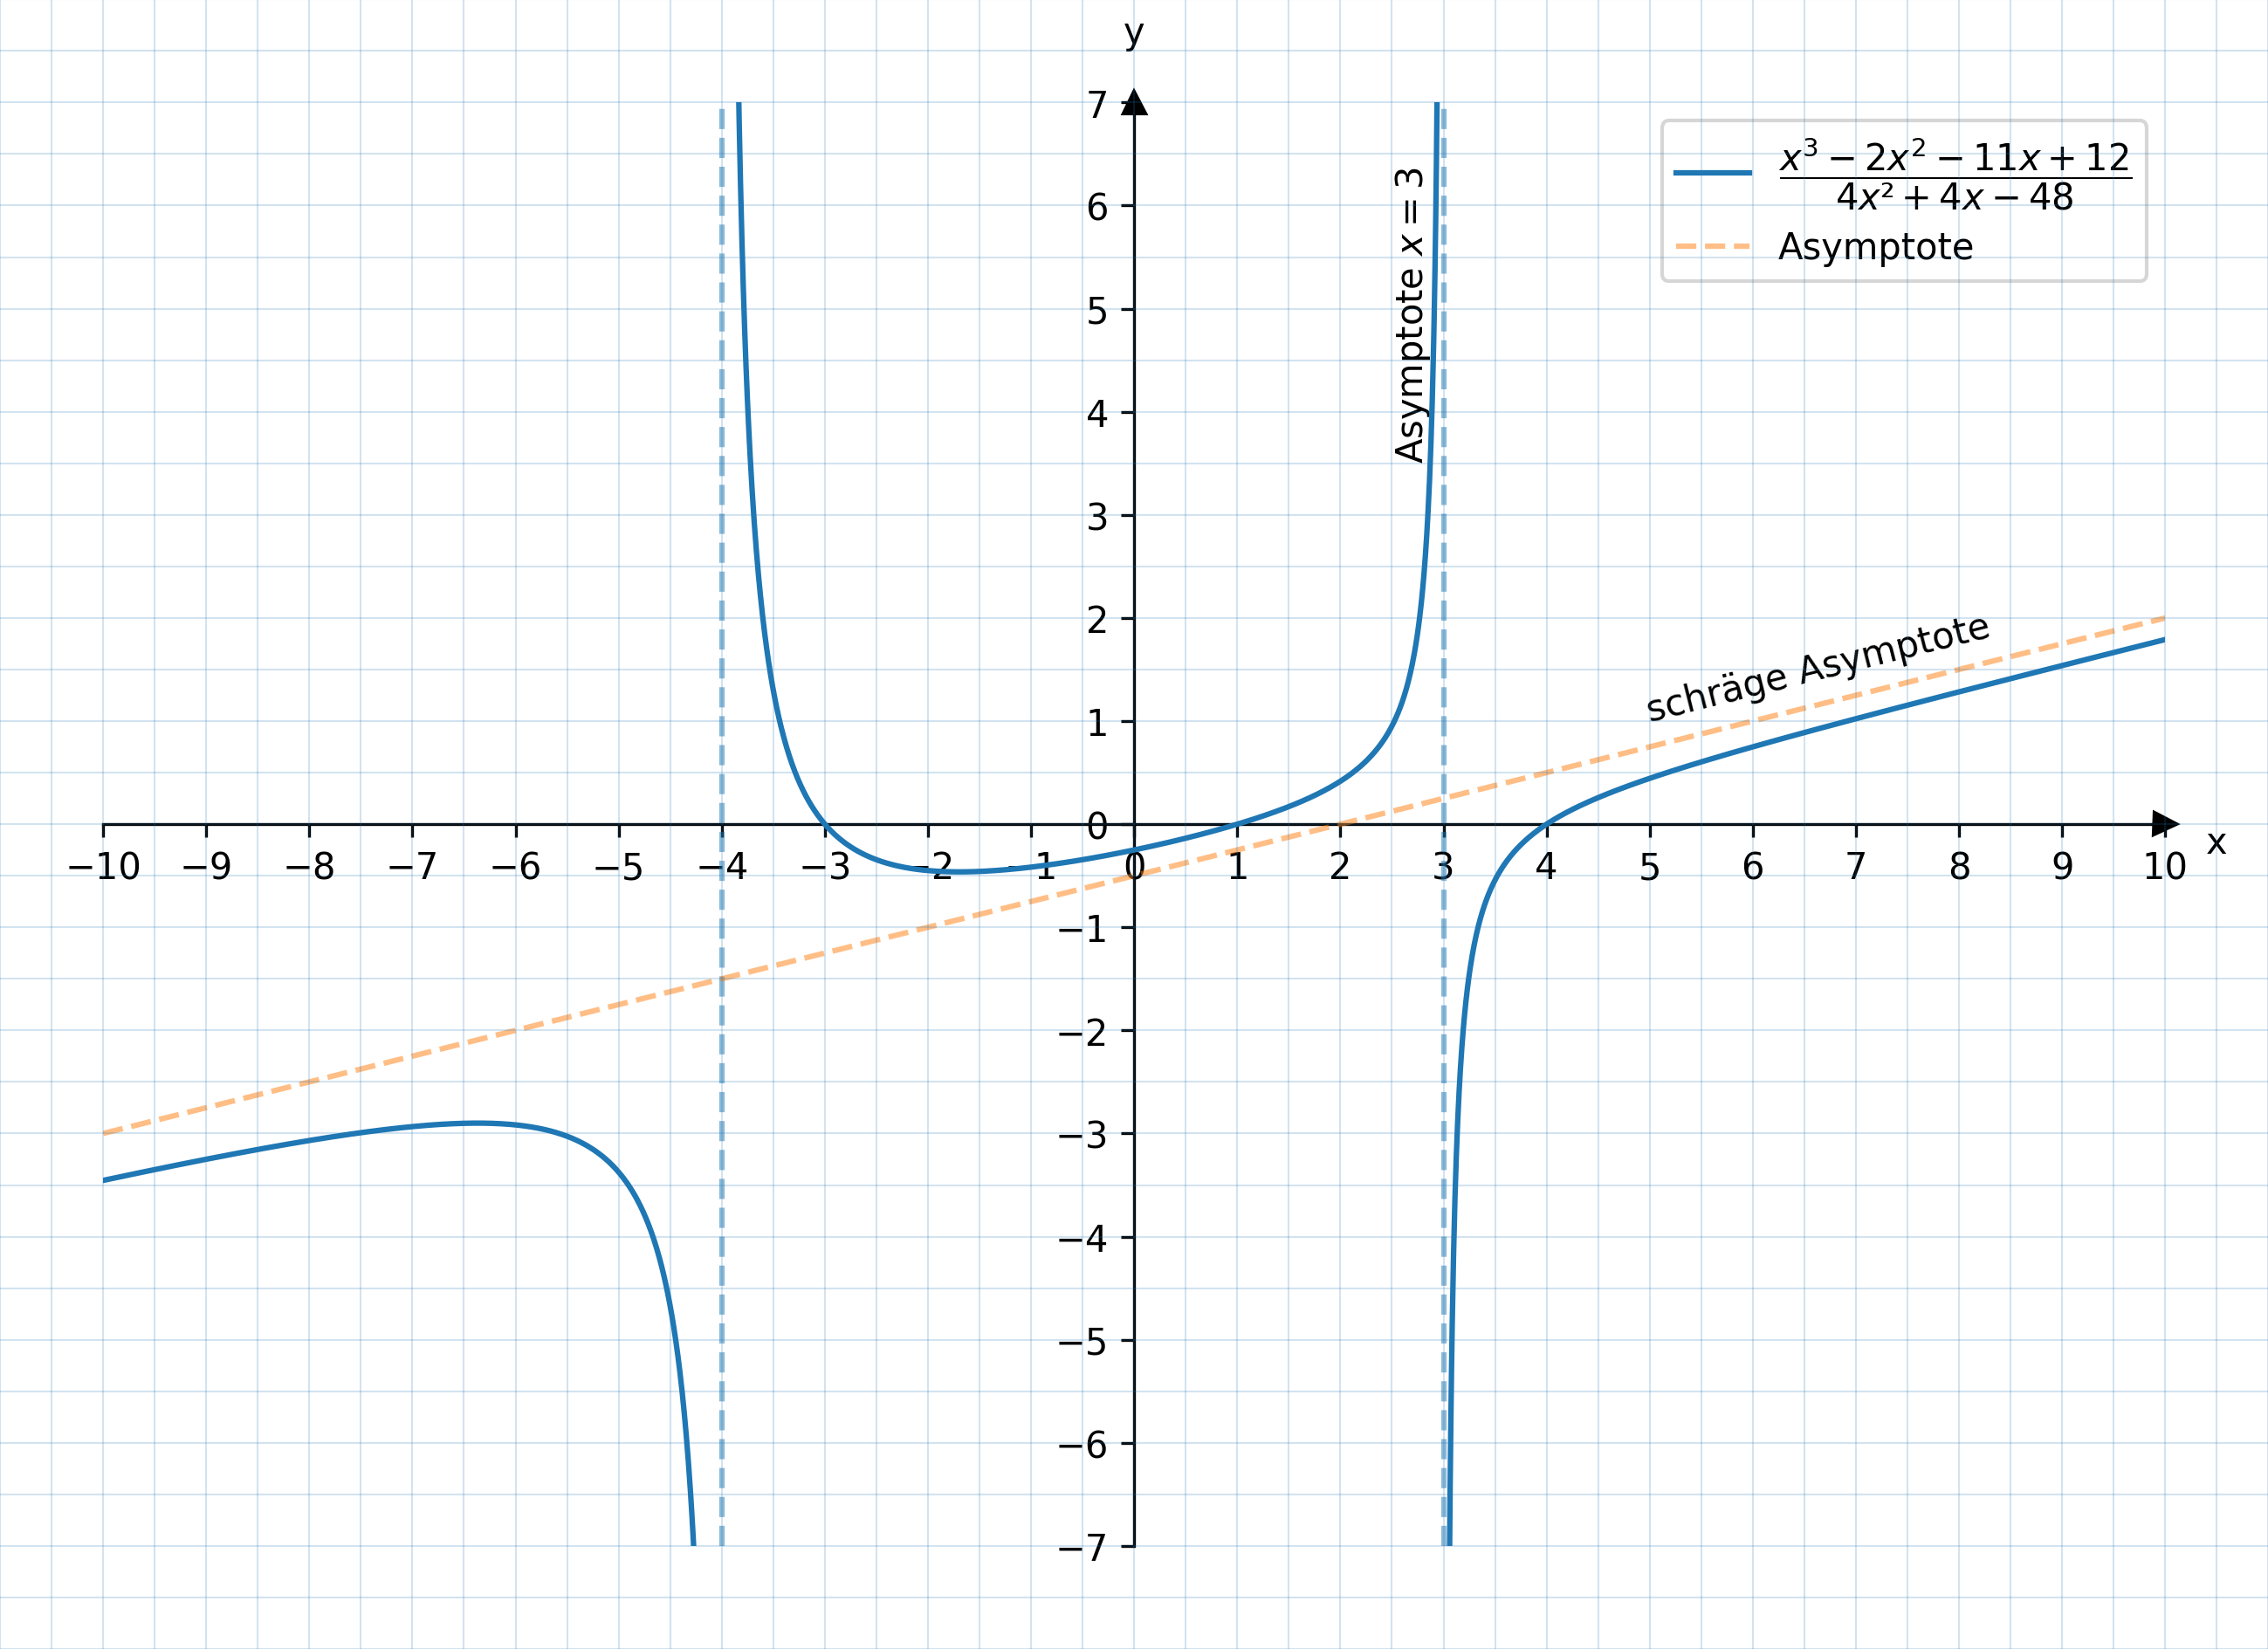
Text
Beliebiger Text kann unter items mit dem Typ Text angegeben werden.
| figure:
height: 16cm
width: 22cm
axes_descriptors:
- axes:
height: 14cm
width: 20cm
x_min: -10
y_min: -7
bottom: 1cm
left: 1cm
items:
- type: Graph
function: (x-4)*(x-1)*(x+3) / (4*(x-3)*(x+4))
label: $\dfrac{x^3-2x^2-11x+12}{4x²+4x-48}$
- type: Graph
function: 1/4*x -0.5
label: Asymptote
plot_args:
ls: --
alpha: 0.5
- type: VLine
x: 3
plot_args:
ls: --
alpha: 0.5
- type: VLine
x: -4
plot_args:
ls: --
alpha: 0.5
- type: Text
x: 2.8
y: 3.5
text: Asymptote $x=3$
rotation: 90
text_args:
rotation_mode: anchor
ha: left
color: black
- type: Text
x: 5
y: 1
text: schräge Asymptote
rotation: arctan(1/4) * 180 / pi
text_args:
rotation_mode: anchor
ha: left
color: black
|
Letzte Einstellungen

| figure:
height: 16cm
width: 22cm
axes_descriptors:
- axes:
height: 14cm
width: 20cm
x_min: -10
y_min: -7
x_label_offset:
x: 0cm
y: -0.5cm
y_label_offset:
x: 0.5cm
y: -0.25cm
bottom: 1cm
left: 1cm
items:
# - type: Graph
# function: (x**3 - 2*x**2 -11*x + 12)/(4*x**2 + 4*x -48)
- type: Graph
function: (x-4)*(x-1)*(x+3) / (4*(x-3)*(x+4))
label: $\dfrac{x^3-2x^2-11x+12}{4x²+4x-48}$
- type: Graph
function: 1/4*x -0.5
label: Asymptote
plot_args:
ls: --
alpha: 0.5
- type: VLine
x: 3
plot_args:
ls: --
alpha: 0.5
- type: VLine
x: -4
plot_args:
ls: --
alpha: 0.5
- type: Text
x: 2.8
y: 3.5
text: Asymptote $x=3$
rotation: 90
text_args:
rotation_mode: anchor
ha: left
color: black
- type: Text
x: 5
y: 1
text: schräge Asymptote
rotation: arctan(1/4) * 180 / pi
text_args:
rotation_mode: anchor
ha: left
color: black
|